Does Coverage Represent Software Quality?
Key Idea
Many believe that code coverage (how much code is exercised by tests) is a direct indicator of software quality. But how accurate is this belief?
Popular Belief vs. Theoretical Model
Reference: T. Williams et al, “Code Coverage: What Does It Mean in Terms of Quality?”, 2001 [1]
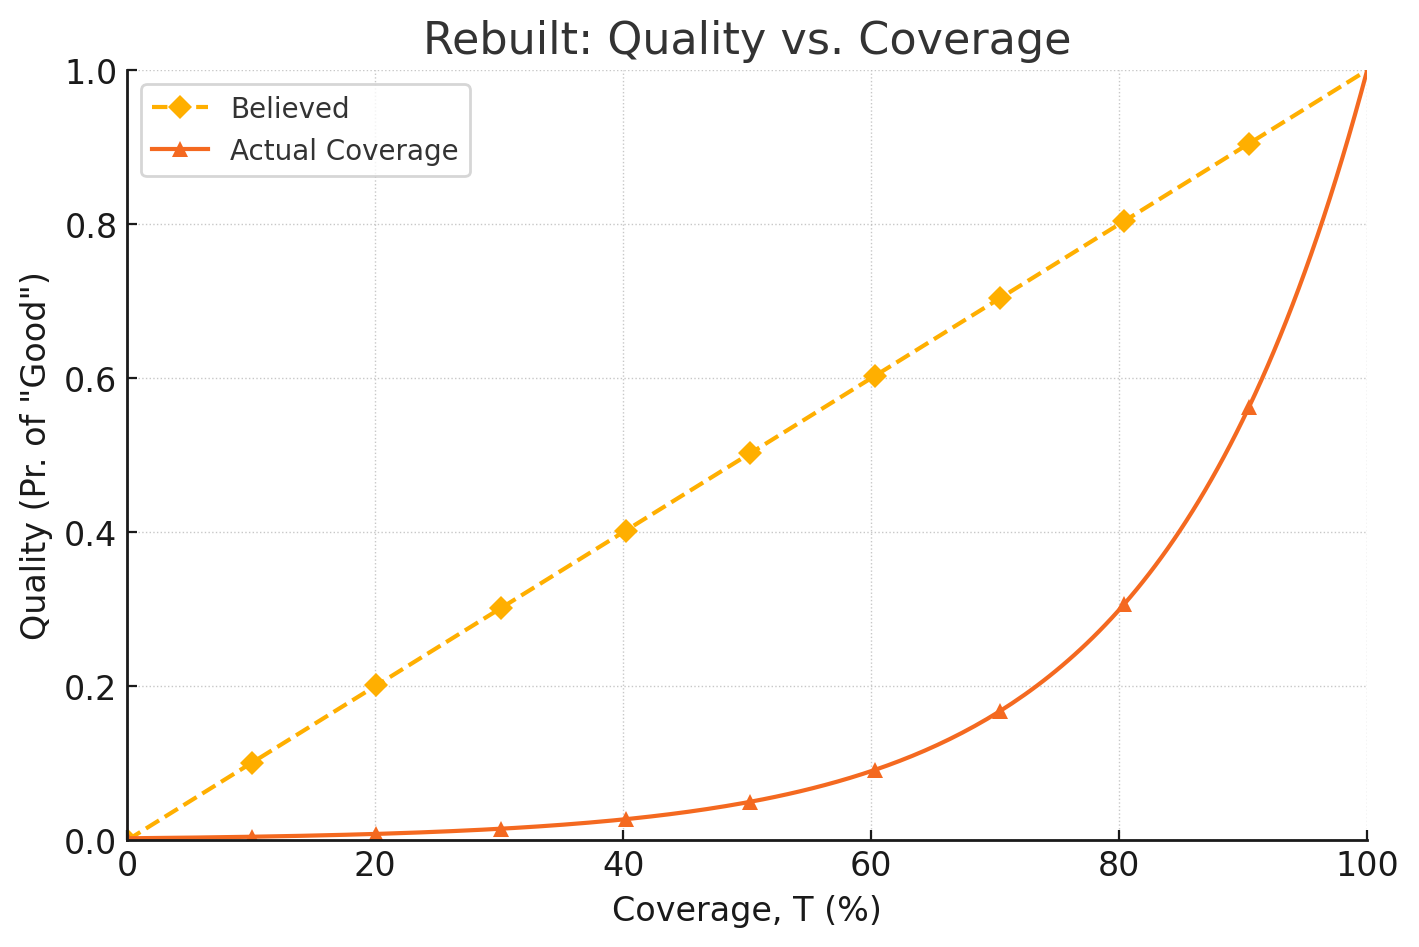
Popular Belief:
- “If I test 50% of the code, I catch 50% of the defects.”
This assumes defects are evenly distributed and detected in proportion to coverage.
Theoretical Model (Hypergeometric + Binomial):
-
In reality, defects can cluster in untested parts of the code.
-
Even at 70% coverage, there’s a significant chance you missed all critical defects.
-
Mathematical formula (simplified):
where:
-
\(T\): coverage fraction (e.g., 0.7 for 70%)
-
\(p\): defect probability per statement
-
\(n\): number of code statements
Key Takeaway:
- Popular belief: “70% coverage ⇒ 70% chance code is defect-free.”
- Reality: “70% coverage ⇒ maybe 5–10% chance of no lurking defects.”
Empirical Findings
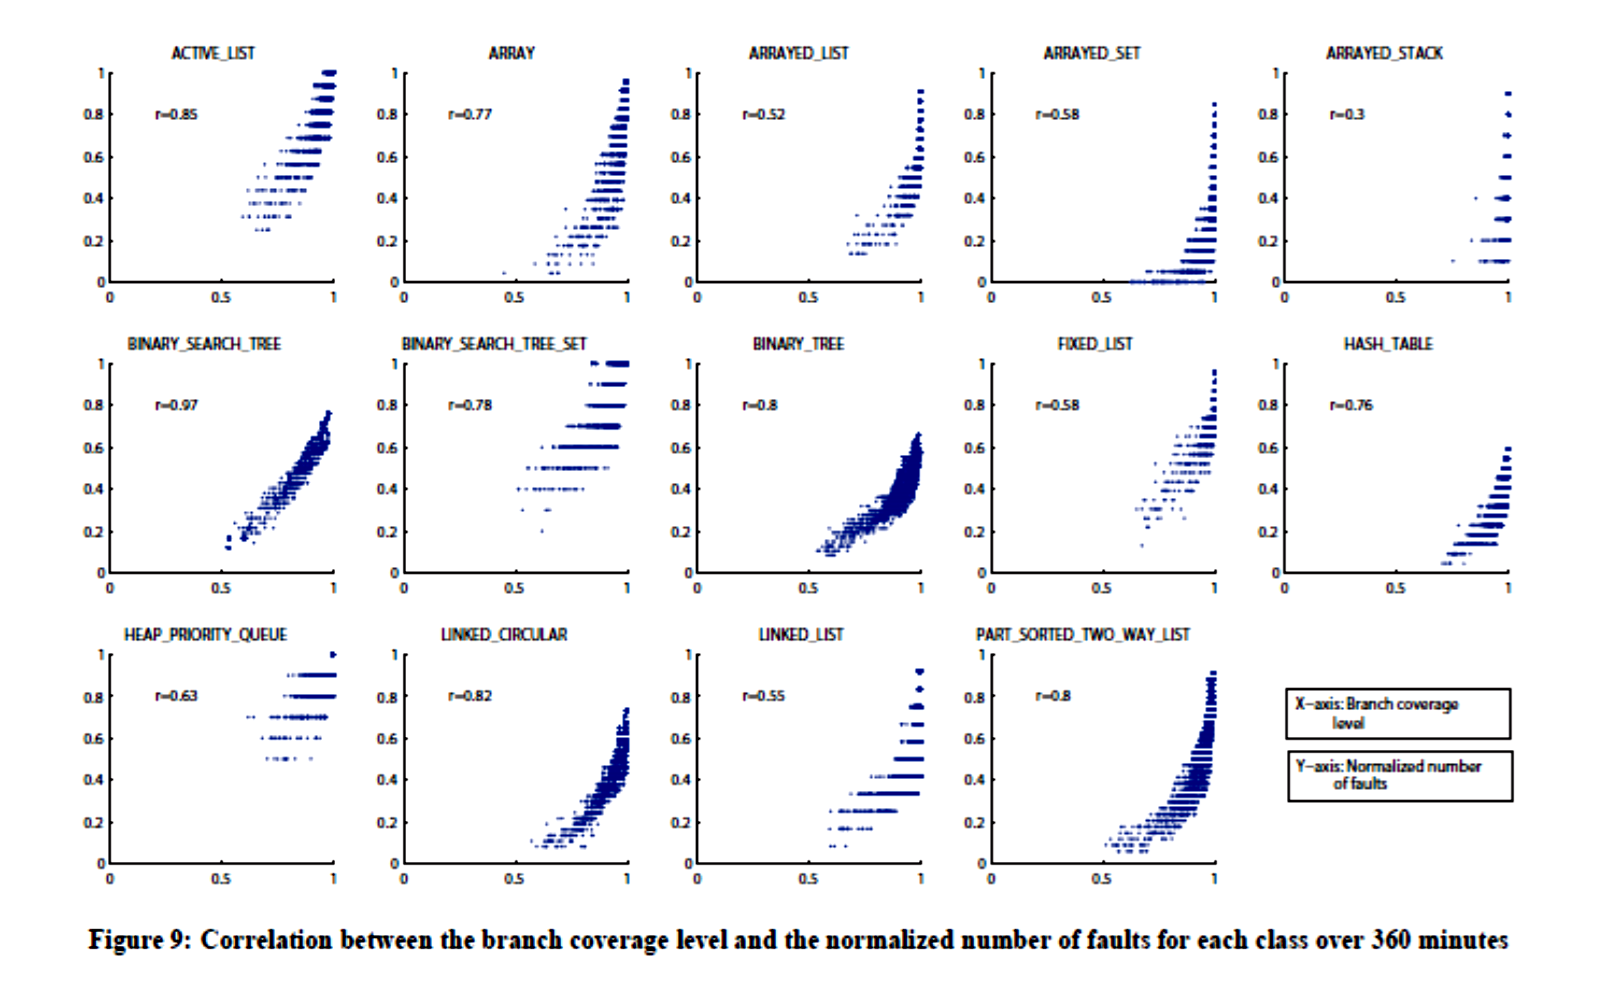
Reference: Wei et al, “Is Coverage a Good Measure of Testing Effectiveness?”, 2010 [2]
-
Experiments show that fault detection initially rises with branch coverage but later continues even when coverage plateaus.
-
In early testing, more coverage = more faults found.
-
Later, even with little new coverage, testers keep finding new faults.
-
Conclusion: Coverage is a good start but not a complete measure of test effectiveness.
Caveat - 100% refers to the totality of faults found, not to the totality of faults that might exist
Summary of Main Findings (Williams et al, 2001)[1]
-
Coverage ≠ Defect-Free Code
100% coverage does not guarantee all defects are found. -
Mathematical Model
Assumes defects randomly distributed across code.
Uses binomial and hypergeometric models to calculate quality vs. coverage. -
Exponential Fault Detection Growth
Defect detection grows faster than coverage—but not linearly.
Gains flatten after ~85–90% coverage. -
Formula for Quality vs. Coverage:
-
\(T\): code coverage fraction
-
\(P_e\): defect probability per statement
-
\(n\): total number of statements
- Key Implications
- 85% coverage is a meaningful industry target—but even then, some defects might remain.
- Random subsets of tests can miss different defects.
Coverage is necessary but insufficient to ensure software quality. Defect detection grows with coverage—but with diminishing returns, and never guarantees completeness.
Key Observations from Wei et al (2010) [2]
-
Early Phase: High Gains
Branch coverage and fault detection rise together.
Example: In 10 min of testing, 93% of branch coverage and 54% of faults are achieved. -
Plateau Phase: Diminishing Returns
After initial rise, coverage increases very little, but fault detection continues.
Over 50% of faults found during plateau phase. -
Coverage–Fault Correlation Varies
Correlation between coverage and fault detection varies greatly by code area (from weak r=0.3 to strong r=0.97). -
Implications
- Early in testing, coverage is a good indicator.
- Later, coverage stops being useful—new faults can still emerge.
Coverage Anti-Patterns: Clues, Not Commands
Reference: Brian Marick, “How to Misuse Code Coverage”, 1997 [3]
Marick identified fundamental limitations and misuses of coverage that remain relevant today.
The Fundamental Limitation
“It can only tell me how the code that exists has been exercised. It can’t tell me how code that ought to exist would have been exercised.” — Marick
Faults of omission—bugs fixed by adding code that should have existed—are completely invisible to coverage tools. These include:
- Missing error handling
- Unchecked status returns
- Missing boundary conditions
- Absent exception handlers
Robert Glass’s research [4] found that faults of omission (“code not complex enough for the problem”) are among the most common defects in fielded systems.
Common Misuses
| Anti-Pattern | Problem |
|---|---|
| Designing tests FOR coverage | Creates uniformly weak test suite; misses faults of omission |
| Quick tests to satisfy tool | Treats coverage as a command, not a clue |
| 85% as shipping gate | People cluster at threshold and stop thinking |
| Ignoring low coverage | Misses the process signal |
The Right Approach
Marick’s key observation:
“If a part of your test suite is weak in a way coverage can detect, it’s likely also weak in a way coverage can’t detect.”
Healthy practices:
- Design tests from requirements first, not from coverage goals
- Use coverage to find gaps in test design, not as the design method
- Treat low coverage as a process problem, not just a test gap
- Track trends over time, not absolute numbers
- Combine with specification-based testing
The 85% Myth
Marick traced the common 85% threshold and found it essentially arbitrary—someone “pulled it out of a hat.” The actual appropriate threshold depends heavily on:
- Application criticality
- Code complexity
- Testing approach used
- Risk tolerance
Modern Empirical Findings (2014-2025)
Recent research has significantly advanced our understanding of coverage-effectiveness relationships.
The Size Confounding Problem
Reference: Inozemtseva & Holmes 2014 (ICSE Landmark) [5]
The most important finding of the past decade:
“Coverage is NOT strongly correlated with test suite effectiveness when the size of the test suite is controlled for.”
| Condition | Correlation |
|---|---|
| Size ignored | 0.79 - 0.95 (appears strong) |
| Size controlled | ~0 (essentially none) |
What this means: The perceived correlation between coverage and fault detection is largely an artifact of test suite size. Larger suites have both higher coverage AND find more faults—but coverage isn’t the cause.
Lu et al. (2025) [6] quantified this effect:
- Statement coverage: 69% of observed effect explained by size
- Branch coverage: 81.9% explained by size
Assertions Matter More Than Coverage
Reference: Zhang & Mesbah 2015 [7]
| Factor | Correlation with Effectiveness |
|---|---|
| Assertion quantity | 0.927 - 0.973 |
| Statement coverage (alone) | Weak when assertions controlled |
“The strong correlation often observed between test suite size and effectiveness is actually driven by the number and quality of assertions within those tests.”
Practical implication: Focus on assertion quality, not just coverage percentage. A test that executes code without checking results provides false confidence.
Data-Flow Coverage Outperforms Control-Flow
Reference: Hemmati 2015 [8]
Empirical study on 274 real-world faults from Defects4J:
| Criterion | Faults Detected |
|---|---|
| Statement Coverage | 10% |
| Branch Coverage | 19% |
| MC/DC | 19% |
| All control-flow combined | 28% |
| + Data-flow (def-use pairs) | 85% |
Key finding: Statement coverage misses 90% of real faults. Adding data-flow coverage detects an additional 79% of faults that control-flow criteria miss entirely.
See Data-Flow Coverage for details on DU pairs and coverage criteria.
The Coincidental Correctness Problem
Reference: Masri & Abou Assi 2009 [9]; Abou Assi et al. 2021 [10]
Coincidental correctness (CC) occurs when a test executes faulty code but produces correct output anyway.
| Type | Prevalence | Impact |
|---|---|---|
| Strict CC | 15.7% of tests | Fault triggered but output correct |
| Weak CC | 56.4% of tests | Fault executed, output correct |
Why it matters: CC tests give false confidence. They appear to validate code while actually masking hidden faults. High coverage with many CC tests is worse than lower coverage with fault-detecting tests.
Fault Type Dependency
Reference: Schwartz et al. 2018 [11]
Not all faults are equally detectable by coverage-based testing:
| Fault Type | Detection Rate at 80%+ Coverage |
|---|---|
| Arithmetic operator replacement (AORB) | High |
| Relational operator replacement (ROR) | High |
| Arithmetic deletion (AODU) | 12.12% |
| Type cast insertion (PCI) | Very low |
Implication: Even with high coverage, certain fault categories escape detection. Oracle strength (assertion quality) is the critical factor for these faults.
The Reliability Hierarchy
Reference: Zhang et al. 2024 [12]
After reviewing test effectiveness research, Zhang et al. established metric reliability:
| Metric | Reliability | Risk Level |
|---|---|---|
| Mutation Score | Highest | Lowest |
| Branch Coverage | Medium | Medium |
| Statement Coverage | Lowest | Highest |
“Mutation score is the least risky metric for quantifying test suite effectiveness.”
Practical Guidelines
Based on the research above, these practices help use coverage effectively:
- Design tests from requirements first — then measure coverage to find gaps, not the other way around
- Focus on assertion quality — a test that executes code without checking results provides false confidence (Zhang & Mesbah 2015)
- Investigate uncovered code explicitly — low coverage is a process signal worth understanding
- Combine control-flow and data-flow coverage — data-flow catches 79% of faults that control-flow misses (Hemmati 2015)
- Track trends, not thresholds — prevent regression rather than targeting arbitrary numbers
- Use mutation testing for critical code — mutation score is the most reliable effectiveness metric (Zhang et al. 2024)
- Accept diminishing returns — gains flatten after ~85-90% coverage; invest effort elsewhere
Coverage Tool Support
| Language | Tools |
|---|---|
| Java | JaCoCo, Cobertura, Clover |
| Python | Coverage.py, pytest-cov |
| JavaScript | Istanbul, NYC, c8 |
| C/C++ | gcov, lcov, OpenCppCoverage |
| C# | dotCover, OpenCover, Coverlet |
| Go | go test -cover |
Integration: CI/CD pipelines, IDE visualization, code review reports (SonarQube, Codecov).
Conclusion
Code coverage is essential for testing effectiveness but is not a perfect measure of quality.
Key takeaways from the research:
- Coverage ≠ quality — test suite size explains most of the observed correlation (Inozemtseva & Holmes 2014)
- Assertion quality matters more than coverage percentage (Zhang & Mesbah 2015)
- Data-flow coverage dramatically outperforms control-flow alone (Hemmati 2015)
- Mutation score is the most reliable metric for test effectiveness (Zhang et al. 2024)
- Faults of omission are invisible to all coverage tools (Marick 1997)
- Coverage gives clues, not commands — use it to find gaps, not as a design method
References
- T. W. Williams, M. R. Mercer, J. P. Mucha, and R. Kapur, “Code coverage, what does it mean in terms of quality?,” in Annual reliability and maintainability symposium. 2001 Proceedings. International symposium on product quality and integrity (Cat. No. 01CH37179), IEEE, 2001, pp. 420–424.
- Y. Wei, M. Oriol, and B. Meyer, “Is coverage a good measure of testing effectiveness?: An assessment using branch coverage and Random testing,” Technical report, vol. 674, 2010.
- B. Marick, “How to Misuse Code Coverage.” Testing Foundations, 1997. Available at: http://www.exampler.com/testing-com/writings/coverage.pdf
- R. L. Glass, “Persistent Software Errors,” IEEE Transactions on Software Engineering, vol. SE-7, no. 2, pp. 162–168, Mar. 1981, doi: 10.1109/TSE.1981.234514.
- L. Inozemtseva and R. Holmes, “Coverage is Not Strongly Correlated with Test Suite Effectiveness,” in International Conference on Software Engineering (ICSE), ACM, 2014, pp. 435–445. doi: 10.1145/2568225.2568271.
- Z. Lu, Y. Wang, Y. Rong, and others, “Understanding the potentially confounding effect of test suite size in test effectiveness evaluation,” ACM Transactions on Software Engineering and Methodology, 2025, doi: 10.1145/3748504.
- Y. Zhang and A. Mesbah, “Assertions Are Strongly Correlated with Test Suite Effectiveness,” in ESEC/FSE 2015, ACM, 2015. doi: 10.1145/2786805.2786858.
- H. Hemmati, “How Effective Are Code Coverage Criteria?,” in IEEE International Conference on Software Testing, Verification and Validation (ICST), IEEE, 2015. doi: 10.1109/ICST.2015.7102580.
- W. Masri and R. Abou Assi, “An Empirical Study of the Factors That Reduce the Effectiveness of Coverage-Based Fault Localization,” in International Workshop on Dynamic Analysis (WODA), ACM, 2009. doi: 10.1145/1555860.1555862.
- R. Abou Assi, W. Masri, and C. Trad, “How detrimental is coincidental correctness to coverage-based fault detection and localization? An empirical study,” Software Testing, Verification and Reliability, vol. 31, no. 8, 2021, doi: 10.1002/stvr.1762.
- A. Schwartz, D. Puckett, Y. Meng, and G. Gay, “Investigating Faults Missed by Test Suites Achieving High Code Coverage,” Journal of Systems and Software, 2018, doi: 10.1016/j.jss.2018.06.024.
- P. Zhang et al., “Assessing Effectiveness of Test Suites: What Do We Know and What Should We Do?,” ACM Transactions on Software Engineering and Methodology, 2024, doi: 10.1145/3635713.
Disclaimer: AI is used for text polishing and explaining. Authors have verified all facts and claims. In case of an error, feel free to file an issue.