Design Structure Matrix & Modularity
A Design Structure Matrix (DSM) is a square adjacency matrix where rows and columns represent system elements (files, classes, modules) and off-diagonal entries indicate dependencies between them [1], [2]. Unlike traditional dependency graphs that become unreadable at scale, DSMs remain compact and analyzable even for systems with thousands of elements.
       A  B  C  D  E
  A  [ .  1  .  .  . ]
  B  [ .  .  1  .  . ]
  C  [ .  .  .  1  . ]
  D  [ 1  .  .  .  1 ]
  E  [ .  .  1  .  . ]
A 1 in row i, column j means element i depends on element j. Marks above the diagonal represent feedback (cyclic) dependencies; marks below represent feed-forward (hierarchical) dependencies.
DSM Operations
DSMs are not just a representation – they come with a systematic set of algorithms for restructuring designs [1], [2].
Partitioning
Reorder rows and columns to achieve lower triangular form, pushing as many marks as possible below the diagonal. This minimizes feedback marks (above the diagonal) and reveals the natural build order of the system [1].
Clustering
Group elements into modules that maximize intra-group dependencies and minimize inter-group dependencies. The goal is to find subsets of DSM elements that are “mutually exclusive or minimally interacting” [1]. A well-clustered DSM shows a block-diagonal pattern: dense blocks along the diagonal (cohesive modules) with sparse entries elsewhere (loose coupling) [2].
Banding
Identify independent or parallel activities that can be executed simultaneously. Elements in the same band have no dependencies on each other and can proceed concurrently [1].
Tearing
When partitioning cannot eliminate all feedback marks, tearing selects specific feedback dependencies to “break” by treating them as assumptions that will be iterated upon. This converts cycles into manageable sequential steps [1].
Propagation Cost
Propagation Cost (PC) measures the proportion of system elements that could be affected, on average, when a change is made to one element – accounting for both direct and indirect dependencies [3].
Measurement Process
- Direct Dependency Matrix ($M$): a binary matrix where entry $m_{ij} = 1$ if element $i$ depends on element $j$
- Visibility Matrix ($V$): computed as the sum of powers of $M$:
where $k$ is the diameter of the dependency graph. Entry $v_{ij} > 0$ means a change to $j$ can eventually reach $i$ through direct or indirect dependency chains.
- Propagation Cost: the fraction of reachable pairs in $V$:
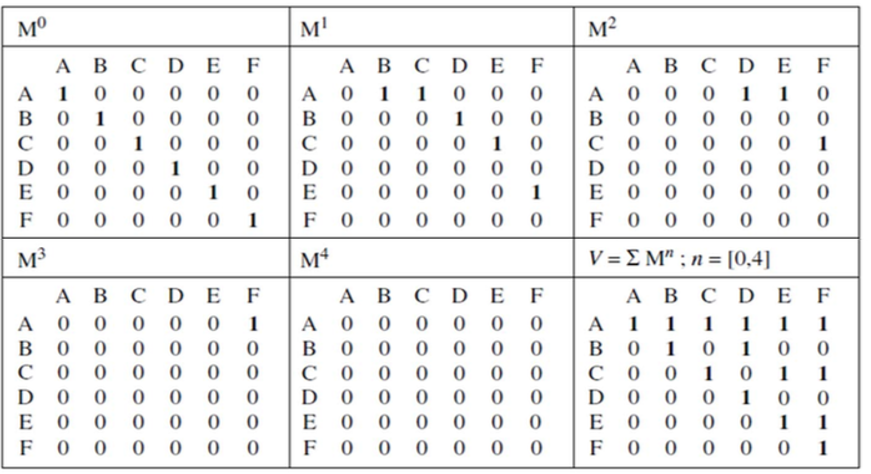
A low PC indicates a modular system where changes are contained locally. A high PC signals a tightly coupled system where changes ripple widely.
The Mozilla vs. Linux Case Study
MacCormack et al. compared two large open-source systems to demonstrate that architecture is a deliberate managerial choice, not merely a byproduct of functional requirements [3]:
| Metric | Linux 2.1.105 | Mozilla (1998) | Mozilla (post-redesign) |
|---|---|---|---|
| Propagation Cost | 5.82% | 17.35% | 2.78% |
| Vertical buses | 14 | 2 | improved |
| Dependency density (per 1000 pairs) | 3.4 | 2.4 | lower |
Despite having fewer raw dependencies per element pair, Mozilla’s 1998 architecture was far more coupled than Linux because its dependencies formed long indirect chains. After a purposeful re-design, Mozilla’s propagation cost dropped from 17.35% to 2.78% – a change to a file now impacted 80% fewer files on average.
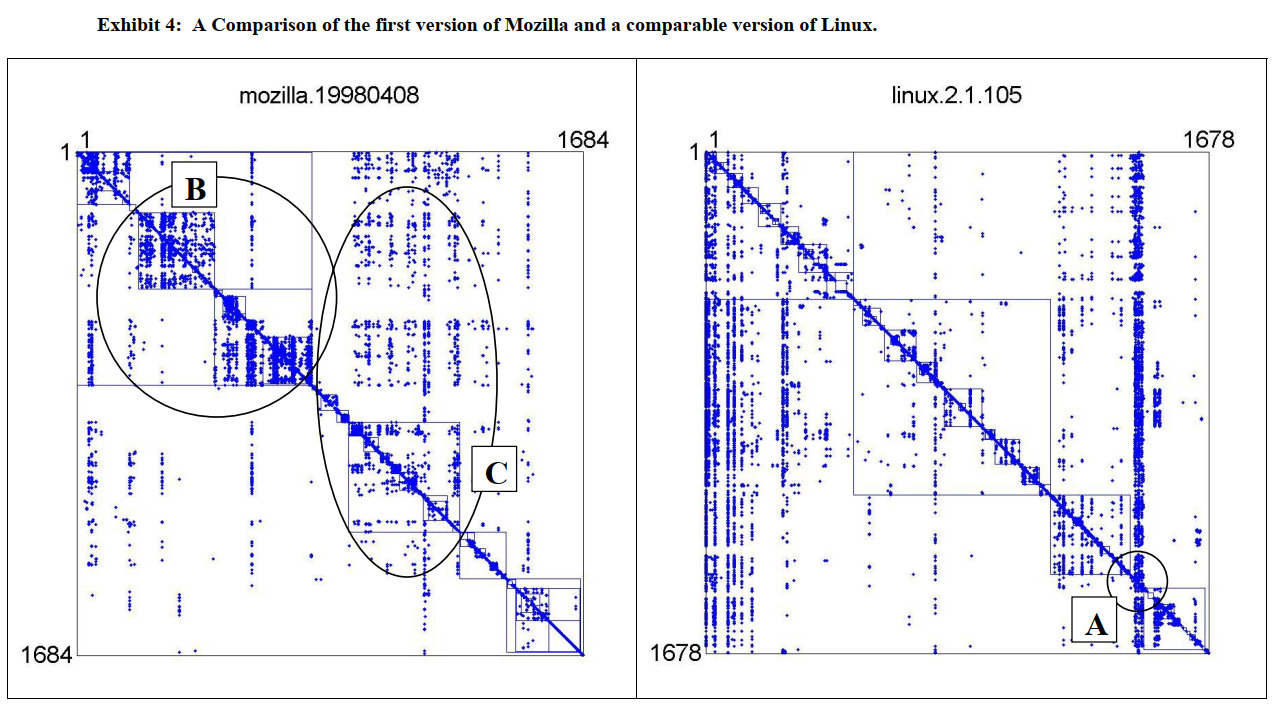
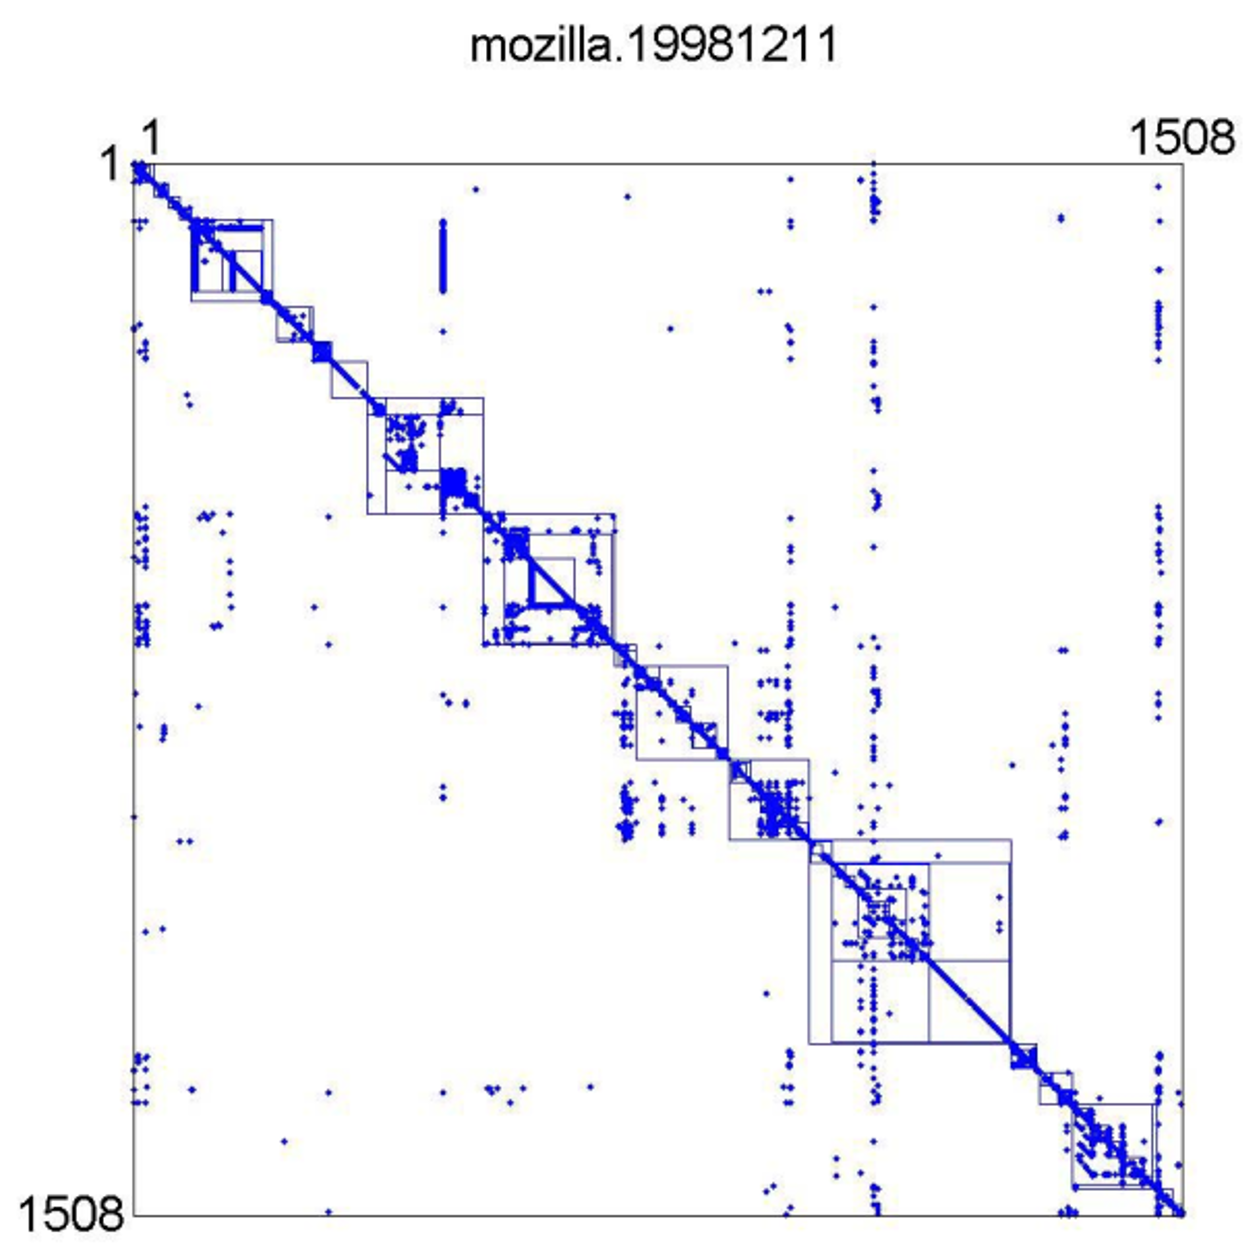
Architecture is not wholly determined by function. The Mozilla re-design proves that architects can significantly adapt a design’s structure through purposeful effort [3].
Net Option Value (NOV)
Sullivan et al. applied Baldwin and Clark’s theory of modularity to software, showing that modular designs create real options – the ability to make independent changes has quantifiable economic value [4].
| Concept | Definition |
|---|---|
| Net Option Value | Expected payoff of modularity, balancing Technical Potential against Redesign and Visibility Cost |
| Environment DSM (EDSM) | Extends the standard DSM by adding exogenous environment parameters that model how external forces drive design changes |
| Information hiding | Decouples design decisions likely to change, enabling independent module modification |
KWIC Case Study
Sullivan et al. tested the theory on Parnas’s classic Key Words in Context (KWIC) system, comparing two decompositions [4]:
- Processing-step decomposition: modules aligned with computational steps – highly coupled
- Information-hiding decomposition: modules aligned with design decisions likely to change – modular
The options-based analysis confirmed Parnas’s original conclusion: the information-hiding decomposition has higher Net Option Value because each module can be independently redesigned without affecting others. This provides an economic justification for Parnas’s design principles beyond the usual engineering arguments.

Limitations of Static DSM Analysis
The Concentration Phenomenon
Geipel and Schweitzer studied 35 large open-source Java projects and found that static dependency structure alone is a poor predictor of actual change dynamics [5]:
| Finding | Value |
|---|---|
| Projects where >50% of dependencies were “change neutral” | 32 out of 35 |
| Share of propagation caused by the top 10% of dependencies | >50% (>70% in Eclipse) |
| Co-change probability for elements with a dependency | 15–60% |
| Co-change probability for elements without a dependency | <5% |
Standard DSM analysis assumes homogeneity – every dependency is equally likely to transmit a change. In reality, most dependencies never transmit a single change during the entire development history, and a small fraction is responsible for the majority of change propagation. This makes static-only propagation estimates “highly inaccurate” [5].
The higher the concentration of change propagation in a small fraction of dependencies, the better refactoring effort can be targeted – focus on the 10% of “active” dependencies rather than minimizing all dependencies globally [5].
Enhanced Propagation Cost
Nord et al. demonstrated that the original binary PC metric fails to detect modifiability improvements from architectural transformations. For example, converting a tightly coupled system to a strictly layered pattern yields the same PC value (33%) before and after – a false negative [6].
Their enhanced variants introduce dependency weights (0 to 1) reflecting the strength of architectural shielding:
| Weight | Meaning | Example |
|---|---|---|
| 0.1 (small) | Strong tactics prevent ripple effect | Encapsulated interface |
| 0.5 (medium) | Some tactics but insufficient shielding | Partial abstraction |
| 1.0 (large) | No tactics, full ripple propagation | Direct dependency |
Three aggregation formulas for parallel paths:
| Formula | Semantics | Use Case |
|---|---|---|
| SUM | Cumulative exposure across all paths | Total risk assessment |
| AVG | Expected propagation assuming equal probability | Typical-case analysis |
| MAX | Worst-case propagation along least-protected path | Conservative estimation |
Applying the “Encapsulate” and “Use an Intermediary” tactics reduced enhanced PC from 24%/18%/23% (SUM/AVG/MAX) down to 13%/13%/13%, correctly detecting the modifiability improvement that binary PC missed [6].
Modifiability Tactics and DSM
Bogner et al. identify 15 modifiability tactics organized in three categories [7]:
| Category | Tactics | Count |
|---|---|---|
| Increase Cohesion | Split Module, Increase Semantic Coherence, … | 5 |
| Reduce Coupling | Encapsulate, Use an Intermediary, Restrict Dependencies, … | 4 |
| Defer Binding Time | Runtime Registration, Configuration Files, … | 6 |

These tactics map directly to observable DSM patterns:
| Tactic | DSM Effect |
|---|---|
| Reduce Coupling | Fewer off-diagonal entries – dependencies between modules decrease |
| Increase Cohesion | Denser diagonal blocks – dependencies within modules increase |
| Split Module | Smaller, more focused clusters with clearer boundaries |
| Use an Intermediary | Replaces direct dependencies with indirect paths through a controlled interface |
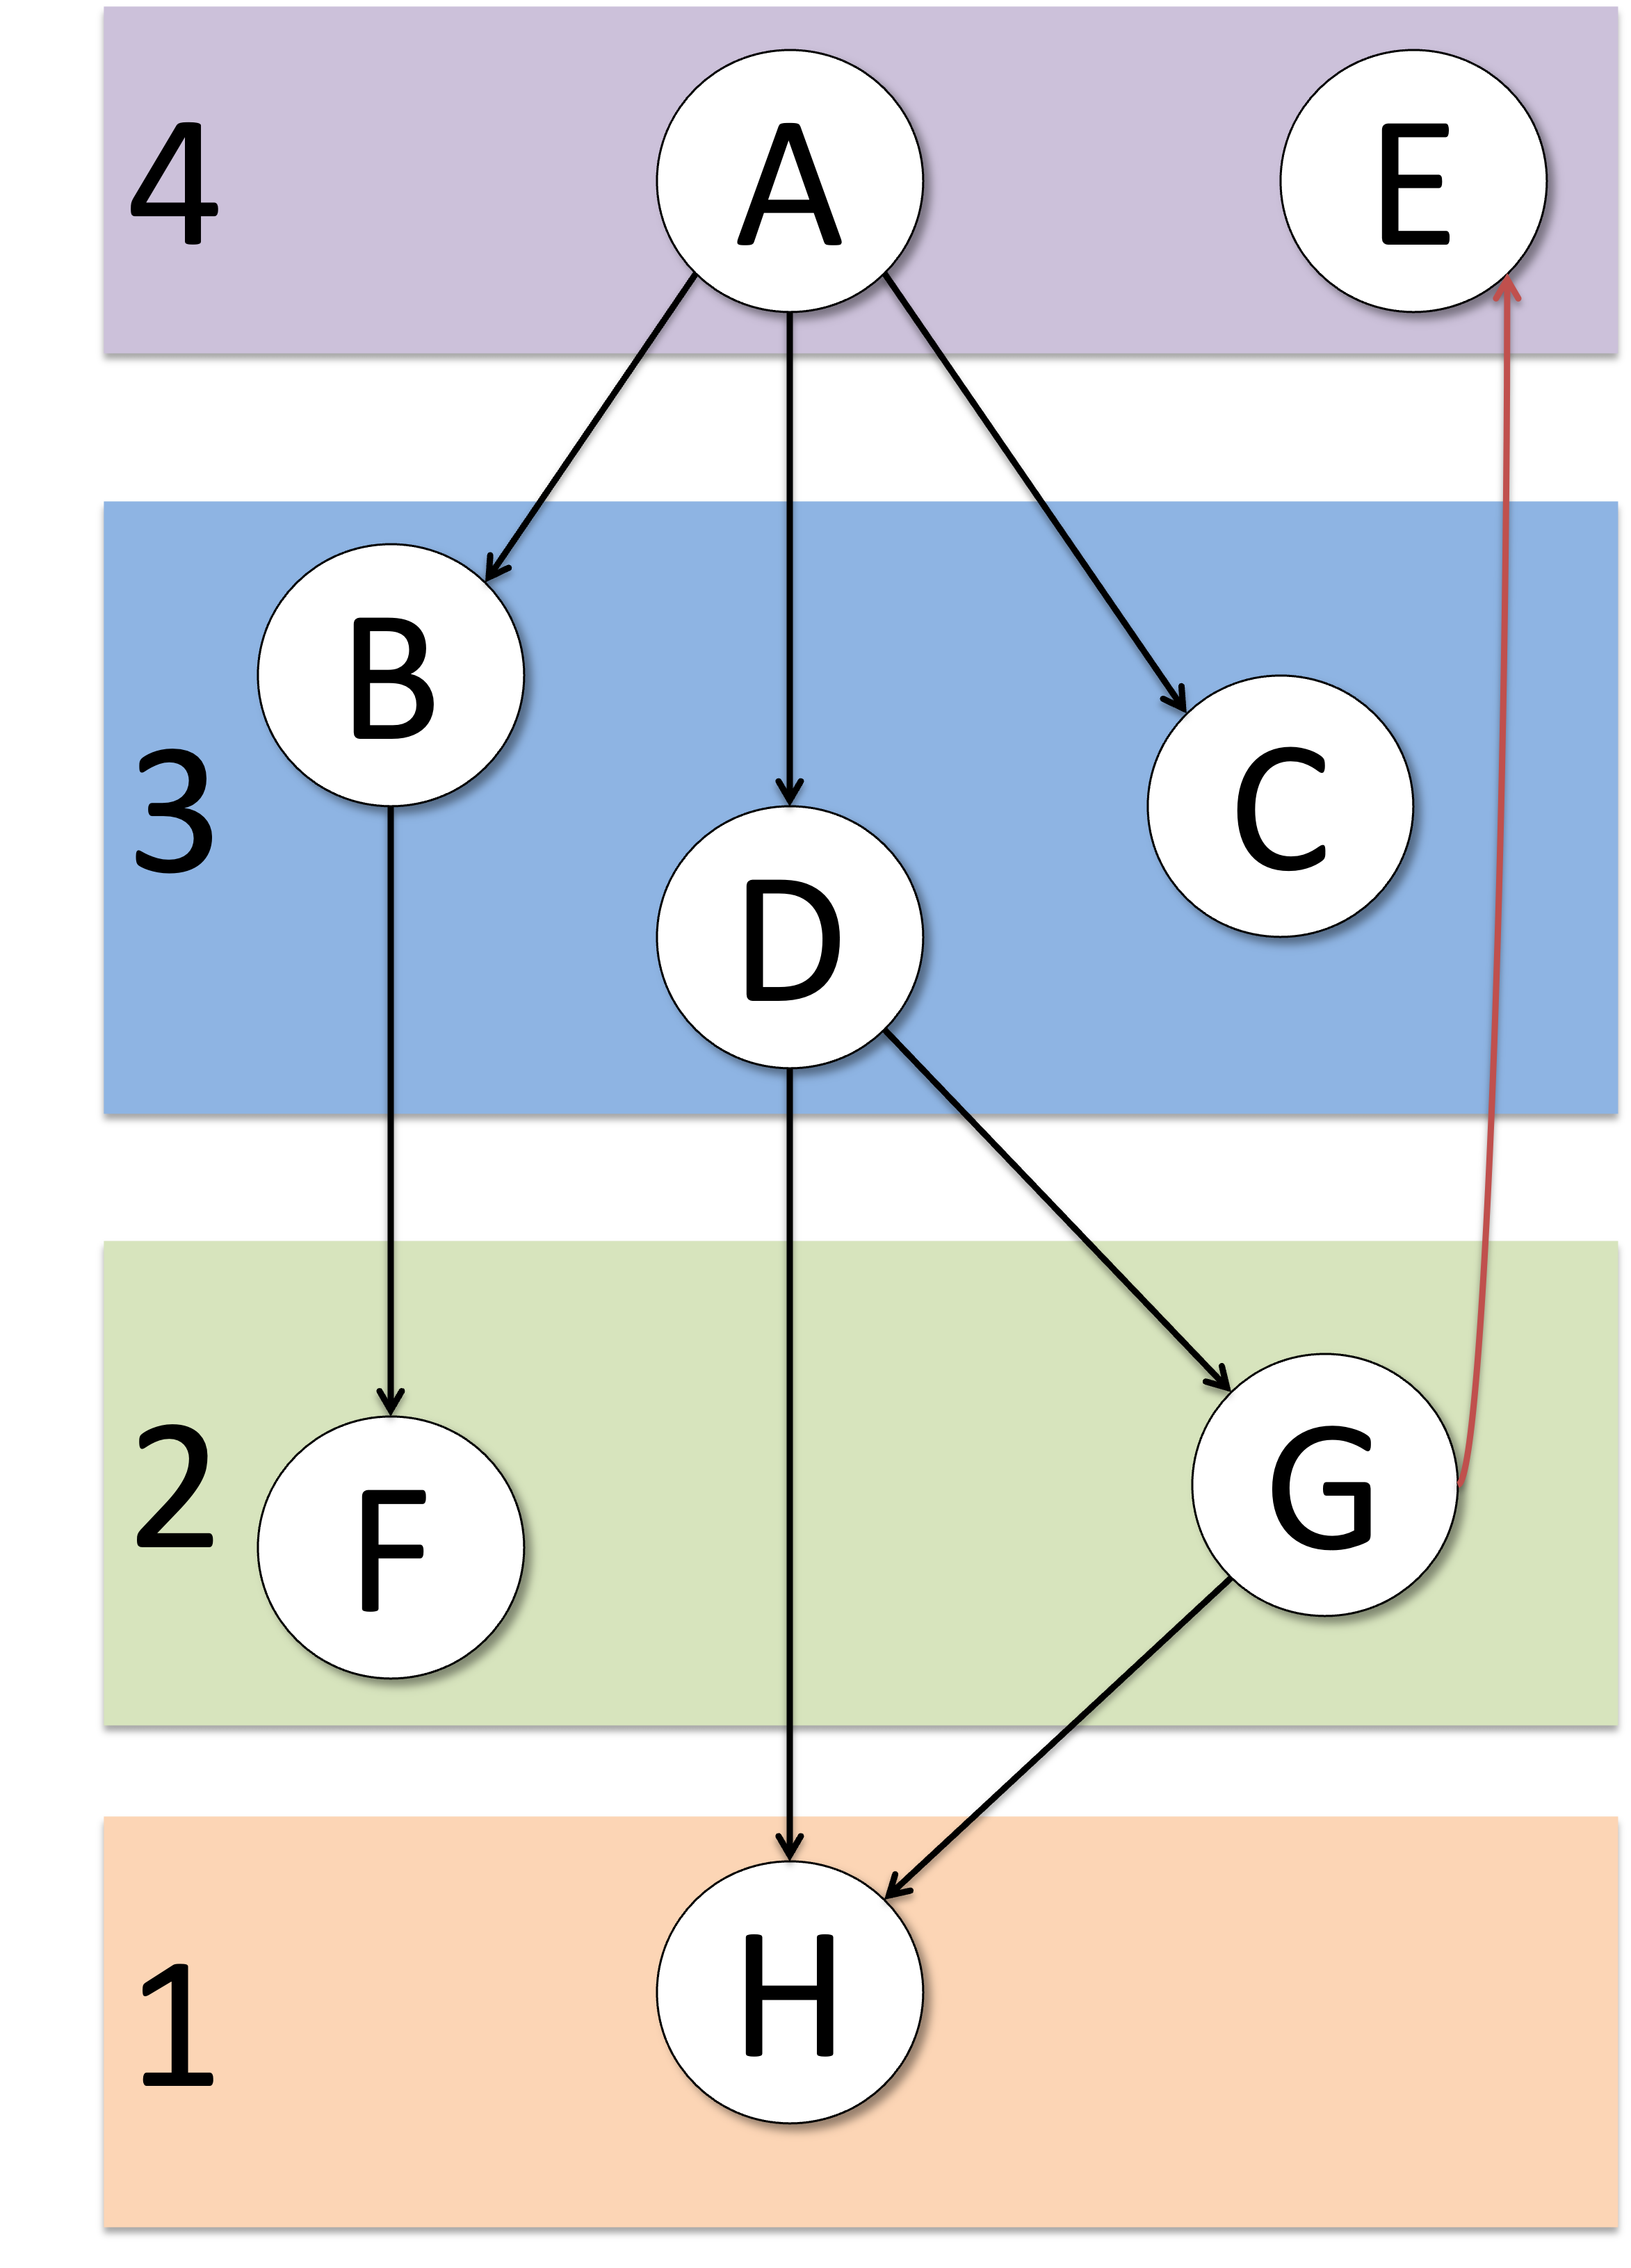
Nord et al. formalized this connection: DSM clustering operationalizes the “Increase Cohesion” / “Reduce Coupling” pair, while partitioning and tearing break cyclical dependencies that are sometimes called “code cancer” [6], [7].
Modularity Beyond OO: Aspect-Oriented Analysis
Ribeiro and Sousa extended DSM analysis to aspect-oriented systems, revealing that while aspects successfully modularize crosscutting concerns, they can reduce class modularity because classes can no longer be understood in isolation [8]. Introducing explicit design rules as visible modules restored both class and crosscutting modularity – reinforcing that information hiding interfaces must be rigorously obeyed regardless of the programming paradigm.
Summary
| Concept | Key Metric | Source |
|---|---|---|
| DSM operations | Partitioning, Clustering, Banding, Tearing | [1] |
| Propagation Cost | % elements affected by average change | [3] |
| Net Option Value | Economic value of modular independence | [4] |
| Concentration phenomenon | 10% of deps cause >50% of propagation | [5] |
| Enhanced PC | Weighted dependencies (0.1 / 0.5 / 1.0) | [6] |
| Modifiability tactics | 15 tactics in 3 categories | [7] |
References
- A. Yassine, “An Introduction to Modeling and Analyzing Complex Product Development Processes Using the Design Structure Matrix (DSM) Method,” Urbana, vol. 51, no. 9, 2004.
- R. Stevens, P. Brook, and K. Jackson, “Design Structure Matrices for Software Development,” in DSM Conference Proceedings, MIT Press, 2007.
- A. MacCormack, J. Rusnak, and C. Y. Baldwin, “Exploring the Structure of Complex Software Designs: An Empirical Study of Open Source and Proprietary Code,” Management Science, vol. 52, no. 7, pp. 1015–1030, 2006, doi: 10.1287/mnsc.1060.0552.
- K. J. Sullivan, W. G. Griswold, Y. Cai, and B. Hallen, “The Structure and Value of Modularity in Software Design,” in Proceedings of the 8th European Software Engineering Conference / 9th ACM SIGSOFT Symposium on the Foundations of Software Engineering (ESEC/FSE), 2001, pp. 99–108. doi: 10.1145/503209.503224.
- M. M. Geipel and F. Schweitzer, “Software Change Dynamics: Evidence from 35 Java Projects,” in Proceedings of the 3rd International Symposium on Empirical Software Engineering and Measurement (ESEM), 2009, pp. 269–279. doi: 10.1109/ESEM.2009.5316009.
- R. L. Nord, I. Ozkaya, R. S. Sangwan, J. Delange, M. Gonzalez, and P. Kruchten, “Variations on Using Propagation Cost to Measure Architecture Modifiability Properties,” in Proceedings of the IEEE International Conference on Software Maintenance (ICSM), 2013, pp. 400–403. doi: 10.1109/ICSM.2013.57.
- J. Bogner, S. Wagner, and A. Zimmermann, “Using Architectural Modifiability Tactics to Examine Evolution Qualities of Service- and Microservice-Based Systems,” SICS Software-Intensive Cyber-Physical Systems, vol. 34, no. 2–3, pp. 141–149, 2019, doi: 10.1007/s00450-019-00402-z.
- H. L. Ribeiro and P. Sousa, “Analyzing Class and Crosscutting Modularity with Design Structure Matrixes,” in Workshop on Aspect-Oriented Programming (AOP), 2007.
Disclaimer: AI is used for text summarization, polishing and explaining. Authors have verified all facts and claims. In case of an error, feel free to file an issue.